How to Monitor CAPTCHA API Performance and Reliability: A Complete Guide
Monitoring API performance is essential for building reliable applications. When an application depends on a CAPTCHA API, slow responses, network failures, unexpected errors, and rate limits can affect user experience and automated testing workflows.
Without proper monitoring, developers may not realize that an integration is becoming slower or less reliable until users or internal teams report a problem.
In this guide, you will learn how to monitor CAPTCHA API performance, which metrics to track, how to build useful dashboards, how to configure alerts, and how to improve reliability in production environments.
Whether you are integrating a CAPTCHA API with Python, Node.js, PHP, Java, Selenium, or Playwright, the principles in this article can help you build a more observable and maintainable system.
Table of Contents
- Why CAPTCHA API Monitoring Matters
- Key CAPTCHA API Performance Metrics
- How to Measure API Latency
- How to Monitor API Errors
- Setting Up Structured Logging
- Building a CAPTCHA API Monitoring Dashboard
- Configuring Alerts for Reliability Issues
- Monitoring CAPTCHA API Integration with Node.js
- Monitoring CAPTCHA APIs in Automated Testing
- Best Practices for CAPTCHA API Reliability
- Common Monitoring Mistakes
- Frequently Asked Questions
1. Why CAPTCHA API Monitoring Matters
A CAPTCHA API integration usually involves several steps, including sending a request, receiving a response, processing a result, and continuing an application workflow.
Depending on the API design, the process may also involve creating an asynchronous task and checking its status until the result becomes available.
A failure at any stage can affect the overall workflow.
For example:
- A request may take longer than expected.
- A server may return an HTTP error.
- A request may fail because of a network timeout.
- A task may not complete within the application's expected time window.
- A client may exceed a provider's rate limit.
- An integration may break after a code or configuration change.
Monitoring helps developers identify these problems before they become widespread.
Benefits of API monitoring
Improved performance: Tracking latency helps identify slow requests and performance regressions.
Faster troubleshooting: Logs and metrics help developers locate the source of an issue.
Better reliability: Alerts make it easier to respond to failures before they affect more users or workflows.
More predictable costs: Monitoring request volume, retries, and polling activity helps identify unnecessary API calls.
Safer deployments: Comparing metrics before and after a release can reveal integration problems early.
For applications that rely on CAPTCHA verification or authorized CAPTCHA testing, monitoring also helps distinguish application-side problems from network issues and provider-side errors.
2. Key CAPTCHA API Performance Metrics
The first step in monitoring a CAPTCHA API is choosing metrics that reflect how the integration actually performs.
Avoid tracking only the total number of successful requests. A system may complete most requests successfully while still experiencing unacceptable latency or intermittent failures.
Essential metrics to track
| Metric | What It Measures | Why It Matters |
|---|---|---|
| Request volume | Number of API requests over time | Identifies usage patterns and traffic spikes |
| Success rate | Percentage of requests completed successfully | Measures overall request reliability |
| Error rate | Percentage of requests that fail | Helps detect outages and integration issues |
| Average latency | Mean request duration | Provides a general performance overview |
| p95 latency | Time within which 95% of requests complete | Reveals slower requests that averages can hide |
| p99 latency | Time within which 99% of requests complete | Highlights the slowest portion of requests |
| Timeout rate | Percentage of requests that exceed configured time limits | Identifies network and responsiveness problems |
| HTTP status distribution | Frequency of HTTP response codes | Helps classify failures |
| Retry rate | Percentage of requests that require retries | Reveals transient failures or unstable dependencies |
| Task completion time | Time required for an asynchronous task to finish | Helps evaluate end-to-end workflow performance |
The availability of specific metrics depends on your application architecture and the information exposed by the API provider.
Average latency versus percentile latency
Average latency is useful, but it can hide problems affecting a smaller number of requests.
Suppose an integration processes 1,000 requests:
- Most requests finish in 300 milliseconds.
- Some requests take 2 seconds.
- A few requests take 8 seconds.
The average might appear acceptable even though some workflows experience significant delays.
Percentile metrics provide a clearer picture:
- p50: The median request duration.
- p95: The duration below which 95% of requests finish.
- p99: The duration below which 99% of requests finish.
For production monitoring, p95 and p99 latency are often more informative than average latency alone.
Measuring success rate correctly
Define success according to the expected behavior of the operation.
For example, an HTTP request that returns a successful status code may still contain an application-level error. Conversely, an intentionally rejected test request may represent an expected outcome rather than a system failure.
A basic success-rate formula is:
Success rate = Successful operations / Total operations × 100%
Document which outcomes count as successful so that your dashboard and alerts remain consistent.
3. How to Measure API Latency
Latency is the time required to complete an operation.
For a CAPTCHA API integration, it is useful to measure both the individual HTTP request duration and the total workflow duration.
Request latency
Request latency measures the time between sending an HTTP request and receiving the response.
It can include network overhead, server processing, and response transmission. It does not necessarily measure the time required for a complete asynchronous operation.
End-to-end task latency
Some APIs use an asynchronous workflow:
- The client submits a task.
- The service returns a task identifier.
- The client checks the task status.
- The client receives a completed result.
In this case, the initial HTTP response may arrive quickly even though the overall operation takes much longer.
Track these durations separately:
- Task submission latency.
- Status-check request latency.
- Time spent waiting for completion.
- Total end-to-end duration.
This distinction helps identify whether delays originate in HTTP communication, task processing, or client-side polling.
Example latency targets
The following values are illustrative internal monitoring targets, not published AllCaptcha service guarantees.
| Metric | Example Target |
|---|---|
| p50 HTTP request latency | Under 500 ms |
| p95 HTTP request latency | Under 2 seconds |
| p99 HTTP request latency | Under 5 seconds |
| Request timeout rate | Below 1% |
| Unexpected HTTP 5xx rate | Below 0.5% |
These targets should be adjusted according to your application's requirements, observed baseline, and any service-level commitments documented by your provider.
Do not use these example values as evidence of a provider's actual performance.
4. How to Monitor API Errors
Error monitoring helps identify recurring problems and separate temporary failures from configuration mistakes.
A useful monitoring system records both the HTTP status code and the application's interpretation of the response.
Common error categories
HTTP 4xx responses
These responses often indicate a client-side issue, such as invalid request data, missing authentication, insufficient permissions, or rate limiting. The exact meaning depends on the API's documentation.
HTTP 429 responses
A 429 response commonly indicates that a request has exceeded a rate limit. Check the provider's documented limits and any available Retry-After header before retrying.
HTTP 5xx responses
These responses indicate a server-side error or an intermediary failure. They may be temporary, but repeated occurrences should be investigated.
Network errors
DNS failures, connection resets, TLS errors, and other transport problems may prevent a request from receiving an HTTP response at all.
Timeouts
A timeout occurs when an operation does not complete within the configured time limit. It may result from network delays, slow processing, or an unsuitable client timeout configuration.
Track error categories separately
Avoid combining every failure into one generic error counter.
Instead, monitor categories such as:
- Authentication and configuration errors.
- Invalid request errors.
- Rate-limit responses.
- Server errors.
- Network failures.
- Timeouts.
- Unexpected response formats.
- Application-level task failures.
This makes alerts more actionable.
For example, a sudden increase in authentication errors after a deployment may indicate a missing environment variable. A rise in timeouts across several unrelated operations may point to a broader network or service issue.
Distinguish expected failures from incidents
In testing environments, some negative responses are intentional. A monitoring system should not treat every expected test failure as a production incident.
Use separate environments, test labels, and alerting rules to prevent routine tests from creating misleading alerts.
5. Setting Up Structured Logging
Logs provide the detail needed to understand individual failures. Metrics show patterns; logs help explain them.
Structured logging stores information in consistent fields rather than relying exclusively on free-form text.
Recommended log fields
A typical API integration log might include:
- Timestamp.
- Environment name.
- Operation name.
- Request or correlation ID.
- HTTP status code, if available.
- Request duration.
- Retry count.
- Error category.
- Timeout indicator.
- Application version.
For asynchronous workflows, you may also record task duration and status transitions, provided these fields are available and safe to store.
Example structured log
The following is an illustrative JSON log entry:
{
  "timestamp": "2026-10-23T10:30:00Z",
  "environment": "staging",
  "operation": "submit_task",
  "request_id": "example-request-123",
  "http_status": 200,
  "duration_ms": 420,
  "retry_count": 0,
  "error_category": null
}
The values are examples, not records from AllCaptcha.
Protect sensitive information
Never log API secrets, authorization headers, passwords, session cookies, or other credentials.
Avoid recording complete request and response bodies unless there is a documented need and an appropriate data-protection process. CAPTCHA-related payloads and tokens may contain security-sensitive information.
Prefer sanitized metadata that supports troubleshooting without exposing sensitive data.
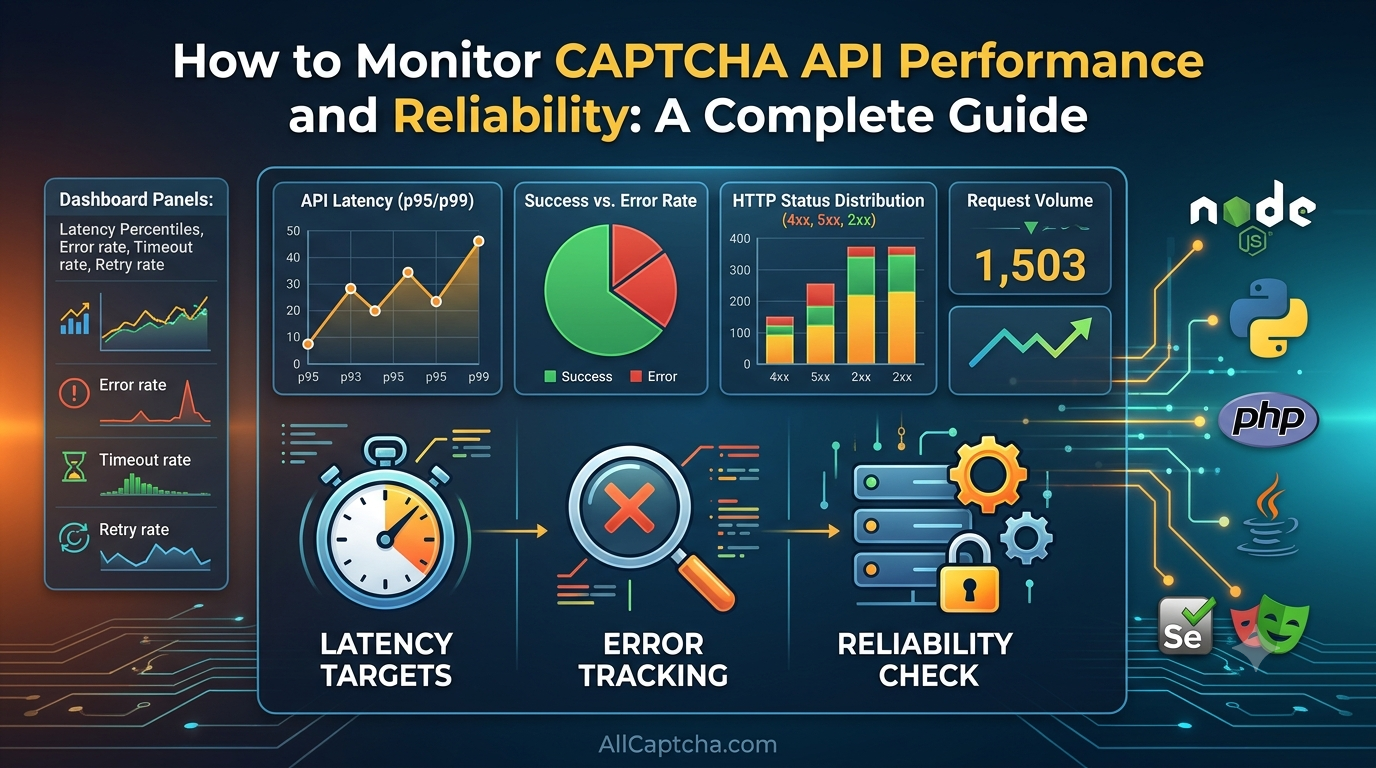
6. Building a CAPTCHA API Monitoring Dashboard
A dashboard should help developers answer three questions:
- Is the integration working?
- Is performance getting worse?
- What is causing the problem?
You can build dashboards with observability platforms such as Prometheus and Grafana, Datadog, New Relic, or an equivalent monitoring system.
Choose a platform that fits your existing infrastructure rather than introducing unnecessary complexity.
Recommended dashboard panels
1. Request volume
Display requests per minute or per hour. Look for sudden spikes, unexpected drops, and changes after deployments.
2. Success and error rates
Show successful operations alongside failures, with separate categories for HTTP errors, network errors, and timeouts.
3. Latency percentiles
Plot p50, p95, and p99 request durations over time.
4. Timeout frequency
Track the number and percentage of requests that exceed their configured timeout.
5. Retry activity
Measure retries per operation and the percentage of operations that require at least one retry.
6. Asynchronous task duration
If the API uses asynchronous tasks, show submission latency, completion time, and the number of tasks that fail to complete within the expected window.
7. Deployment markers
Annotate releases and configuration changes so that performance regressions can be correlated with recent changes.
Example dashboard layout
| Panel | Suggested Visualization |
|---|---|
| Requests per minute | Line chart |
| Success and error rate | Time-series chart |
| p50, p95, and p99 latency | Line chart |
| HTTP status distribution | Stacked bar chart |
| Timeout and retry rate | Time-series chart |
| Task completion duration | Histogram or percentile chart |
| Errors by application version | Table or bar chart |
Use consistent time ranges and units across panels. Avoid adding so many metrics that the dashboard becomes difficult to interpret.
7. Configuring Alerts for Reliability Issues
Monitoring becomes more useful when it notifies the right people about problems that require action.
However, alerts should be based on meaningful conditions. Alerting on every isolated failure can create noise and cause important incidents to be overlooked.
Example alert rules
The following thresholds are illustrative and should be calibrated using your own traffic and baseline measurements.
| Alert | Example Condition | Suggested Response |
|---|---|---|
| Elevated error rate | Error rate exceeds 5% for 5 minutes | Inspect recent failures and deployments |
| High p95 latency | p95 exceeds the established threshold for 10 minutes | Investigate request duration and network behavior |
| Increased timeouts | Timeout rate exceeds 2% for 5 minutes | Check client timeouts, connectivity, and service health |
| Repeated rate limiting | HTTP 429 responses increase sharply | Review documented quotas and request pacing |
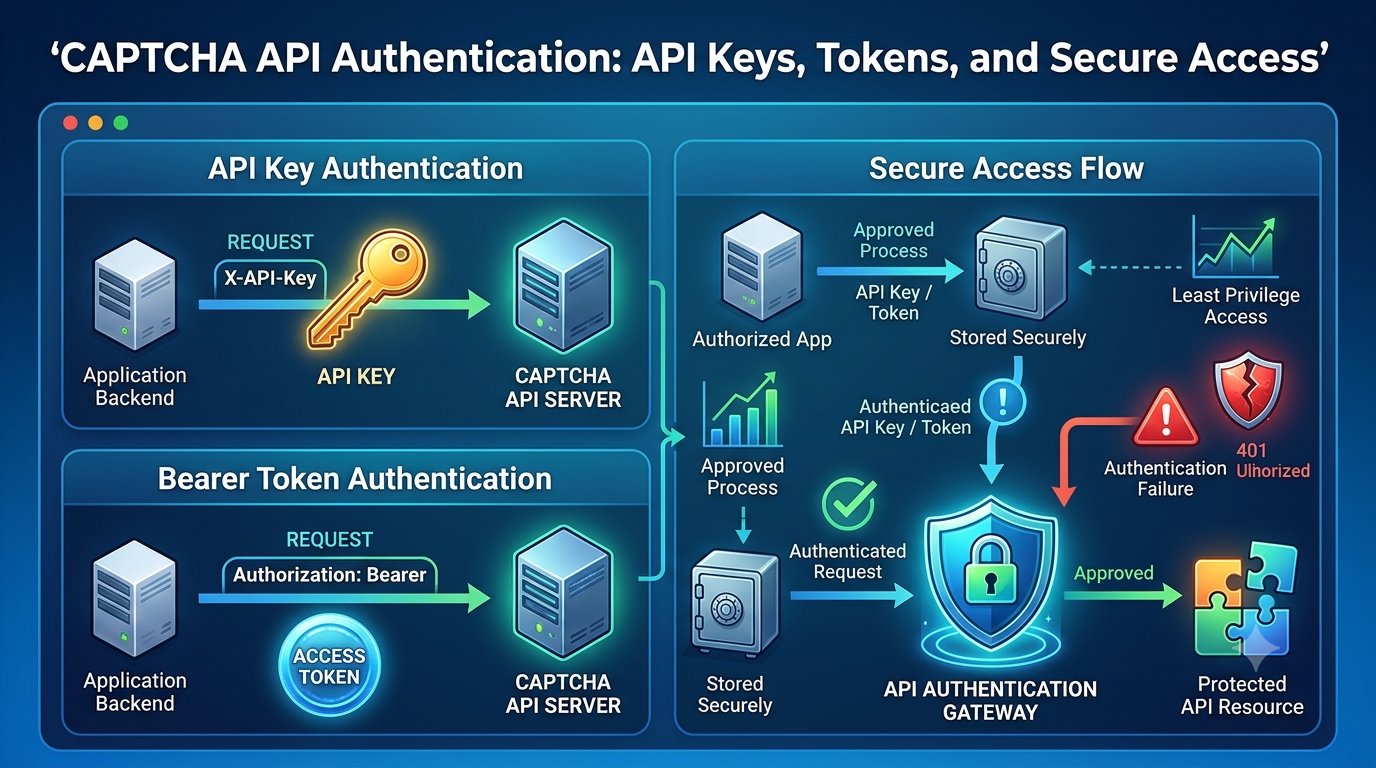
| Authentication failures | Authentication errors appear unexpectedly | Verify credentials and configuration |
| Missing telemetry | Expected monitoring data stops arriving | Check the application and monitoring pipeline |
These values are examples, not AllCaptcha service-level objectives.
Use warning and critical levels
A warning alert can notify the development team about a developing problem. A critical alert should indicate that the issue is severe enough to require immediate investigation.
For example:
- Warning: p95 latency remains above the normal baseline.
- Critical: latency and timeout rates are both elevated, affecting important workflows.
Combining a performance signal with an impact signal can reduce false alarms.
Avoid alerting on individual slow requests
A single slow request does not necessarily indicate an incident. Use rolling windows, minimum sample counts, and sustained conditions where appropriate.
For low-traffic applications, consider longer evaluation windows or synthetic checks. A percentage calculated from only a handful of requests can fluctuate significantly.
8. Monitoring CAPTCHA API Integration with Node.js
The following example demonstrates how to measure HTTP request duration and count failed requests in Node.js.
It uses a generic HTTPS endpoint and is intended to illustrate instrumentation only. Replace the example URL and request body with the documented interface of the API you are authorized to use. The example does not describe an actual AllCaptcha endpoint or request schema.
const { performance } = require("node:perf_hooks");

async function monitoredRequest(url, payload) {
  const startedAt = performance.now();

  try {
    const response = await fetch(url, {
      method: "POST",
      headers: {
        "Content-Type": "application/json"
      },
      body: JSON.stringify(payload),
      signal: AbortSignal.timeout(10000)
    });

    const durationMs = performance.now() - startedAt;

    // Record these values with your monitoring system.
    console.info(JSON.stringify({
      event: "api_request_completed",
      status: response.status,
      duration_ms: Math.round(durationMs)
    }));

    if (!response.ok) {
      throw new Error(`HTTP request failed: ${response.status}`);
    }

    return await response.json();
  } catch (error) {
    const durationMs = performance.now() - startedAt;

    // Do not log secrets, tokens, or full request payloads.
    console.error(JSON.stringify({
      event: "api_request_failed",
      duration_ms: Math.round(durationMs),
      error_name: error.name
    }));

    throw error;
  }
}
What this example measures
The example records:
- Request duration.
- HTTP status for received responses.
- Whether the request failed.
- The error type reported by the runtime.
It also applies a timeout so that a request does not wait indefinitely.
For production use, connect these events to a metrics or observability platform. Calculate latency percentiles from recorded measurements rather than relying on log inspection alone.
Additional production considerations include:
- Classifying network errors separately from HTTP errors.
- Recording retry attempts.
- Redacting sensitive data.
- Avoiding duplicate error counts when one failure is logged at multiple layers.
- Adding a correlation ID to connect related events.
- Handling response parsing errors separately from transport failures.
The timeout value is an example and should be chosen based on the application's requirements and the provider's documented behavior.
9. Monitoring CAPTCHA APIs in Automated Testing
Applications using Selenium, Playwright, or other automation frameworks can benefit from monitoring at both the API and test-workflow levels.
A test may fail even when the API request succeeds. For example, a browser test might encounter a page-loading issue, a changed selector, or an application validation error.
Monitoring should therefore distinguish API performance from overall test performance.
Track separate test metrics
Useful metrics include:
- API request success rate.
- API request latency.
- Browser page-load duration.
- Test execution duration.
- Test pass and failure rates.
- Retry frequency.
- Failure category.
- Environment and application version.
This helps determine whether a failure belongs to the API integration, the browser automation, or the application under test.
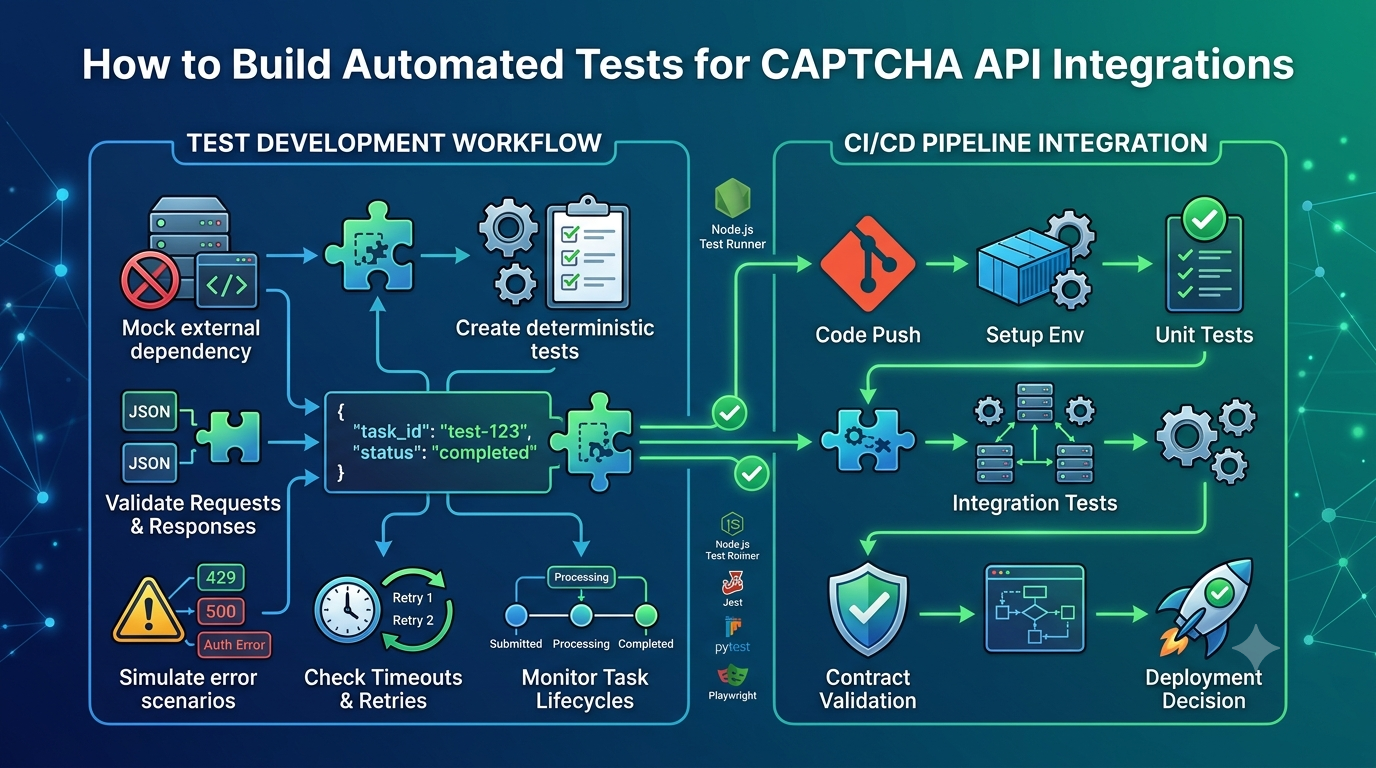
Prefer mocks for deterministic tests
Unit and many integration tests should not depend on a live external service unless that dependency is specifically being tested.
A mock can simulate:
- A successful response.
- A validation error.
- A rate-limit response.
- A network timeout.
- A server error.
- An unexpected response format.
Mocks make tests faster and more predictable while reducing unnecessary requests.
Use approved staging environments for live checks
If you need to evaluate real API behavior, run controlled tests against an authorized staging environment or approved endpoint.
Keep live checks separate from ordinary unit tests. Configure limits, timeouts, and alert rules so that expected test activity does not look like a production incident.
Use provider-supported test modes when available, and verify their availability in the official documentation rather than assuming that every API provides a sandbox.
10. Best Practices for CAPTCHA API Reliability
Monitoring helps identify problems, but reliability also depends on how the client handles failures.
Set appropriate timeouts
Every network operation should have a finite timeout. Choose values based on observed latency and the operation's requirements.
For asynchronous APIs, separate the timeout for submitting a request from the maximum time allowed for the complete workflow.
Retry only when appropriate
Some temporary failures can be retried safely, while others require correcting the request or configuration.
Consider retrying transient network failures and selected server errors. Respect documented rate limits and any Retry-After header.
Do not automatically retry invalid authentication, malformed requests, or other permanent errors without addressing their cause.
Use exponential backoff with jitter
Repeated immediate retries can increase load during an outage.
A common strategy is exponential backoff, which increases the delay between attempts. Jitter adds randomness to reduce the chance that many clients retry simultaneously.
Always enforce a maximum retry count and an overall deadline.
Prevent duplicate operations
If an API supports idempotency keys or another documented mechanism for safe retries, use it according to the provider's instructions.
Do not assume that submitting the same request twice will produce only one operation. Verify the API's behavior before implementing retry logic that could create duplicate tasks or charges.
Control concurrency
Limit the number of simultaneous requests to a level appropriate for your application and the provider's documented limits.
Use queues or worker pools when traffic is unpredictable. This can help prevent request bursts from exhausting resources or triggering rate limits.
Monitor changes over time
Compare performance before and after code deployments, configuration changes, or infrastructure updates.
A gradual increase in latency may be as important as a sudden outage. Review trends over days or weeks to identify performance regressions that short alert windows may miss.
Define measurable reliability objectives
Set internal service-level indicators (SLIs) and service-level objectives (SLOs).
For example, an SLI might measure the percentage of valid API operations completed within a defined time. An SLO could specify the target percentage over a rolling period.
Choose targets based on actual requirements and observed performance. Do not present internal targets as guarantees from the API provider.
11. Common Monitoring Mistakes
Even a well-instrumented application can produce misleading monitoring data if metrics are designed poorly.
Mistake 1: Monitoring only average latency
Average latency can conceal a slow tail. Track p95 and p99 alongside the median and average.
Mistake 2: Counting every HTTP 200 as success
A successful HTTP response may contain an application-level error. Validate the response according to the documented API schema.
Mistake 3: Mixing test and production traffic
Test failures can create false alarms or hide production problems. Label environments and separate their dashboards and alert policies.
Mistake 4: Retrying every error
Unrestricted retries can amplify failures, increase costs, and cause rate limiting. Classify errors before retrying.
Mistake 5: Logging sensitive payloads
Full request and response logs may expose credentials, tokens, or other protected information. Log only the data required for troubleshooting.
Mistake 6: Ignoring asynchronous task duration
Measuring only the initial HTTP request can make a slow end-to-end workflow appear healthy. Track the full operation when asynchronous processing is involved.
Mistake 7: Setting arbitrary alert thresholds
Thresholds that are too strict generate noise; thresholds that are too loose delay detection. Use historical measurements, application requirements, and minimum sample counts to calibrate alerts.
Mistake 8: Failing to test the monitoring system
Alerts can break because of configuration changes or notification delivery problems. Periodically test alert routing and verify that monitoring data continues to arrive.
12. Frequently Asked Questions
What is CAPTCHA API monitoring?
CAPTCHA API monitoring is the process of measuring and evaluating the performance, availability, errors, latency, and reliability of an application's CAPTCHA API integration.
Which metrics are most important?
Start with request volume, success rate, error rate, p95 latency, timeout rate, HTTP status distribution, and retry frequency. If the API uses asynchronous tasks, also monitor end-to-end task duration.
What is a good CAPTCHA API response time?
There is no universal response-time target. The appropriate threshold depends on the API, network conditions, workflow, and application requirements. Measure a baseline and define internal targets based on observed performance and documented provider commitments.
How can I detect CAPTCHA API downtime?
Combine application-side error monitoring, timeout metrics, provider status information when available, and controlled health checks. A sudden rise in failures across multiple requests may indicate an outage, but network and client-side problems should also be considered.
Should I monitor CAPTCHA API requests in real time?
Real-time monitoring is useful for important production workflows, particularly when delays or failures affect users. For lower-priority tasks, periodic reports and trend analysis may be sufficient.
Which tools can I use to monitor API performance?
Common options include Prometheus and Grafana, Datadog, New Relic, and cloud-native monitoring services. The best choice depends on your existing stack, budget, retention requirements, and alerting needs.
How do I monitor an asynchronous CAPTCHA API?
Measure submission latency separately from task completion time. Track task status transitions, total duration, polling frequency, timeout events, and terminal failures where those details are available.
How can I monitor API reliability without sending real CAPTCHA requests?
Use mocks, contract tests, and provider-supported test modes where available. For live checks, use an authorized staging environment and follow the provider's documented usage limits.
Does AllCaptcha provide a monitoring dashboard or status endpoint?
Check the current official AllCaptcha documentation or contact its support team for information about provider-side dashboards, status endpoints, request identifiers, and available usage metrics. Do not assume that a particular monitoring feature or endpoint exists unless it is documented.
Conclusion
Monitoring CAPTCHA API performance and reliability helps developers detect failures earlier, understand latency problems, and maintain predictable application behavior.
Start with a small set of meaningful metrics: request volume, success rate, error rate, p95 latency, timeout frequency, and retry activity. Add structured logging, a dashboard, and carefully calibrated alerts as your integration grows.
For asynchronous APIs, measure the complete workflow rather than only the initial HTTP response. For automated testing, separate API performance from browser-test results and use mocks or approved staging environments whenever practical.
Most importantly, combine monitoring with sensible timeouts, controlled retries, concurrency limits, and secure logging. These practices provide a stronger foundation for reliable API integrations and easier troubleshooting over time.
SEO Metadata
SEO Title: How to Monitor CAPTCHA API Performance and Reliability
Meta Description: Learn how to monitor CAPTCHA API latency, error rates, timeouts, and reliability with practical metrics, dashboards, logging, and alerting best practices.
Focus Keyword: CAPTCHA API monitoring
Secondary Keywords:
- CAPTCHA API performance
- CAPTCHA API reliability
- API latency monitoring
- API error monitoring
- CAPTCHA API timeout
- API monitoring dashboard
- API performance metrics
- API reliability best practices
- CAPTCHA API integration testing
Suggested URL Slug: monitor-captcha-api-performance
Suggested H1: How to Monitor CAPTCHA API Performance and Reliability: A Complete Guide
Internal Linking Suggestions
Add contextual internal links to relevant AllCaptcha articles:
- CAPTCHA API Rate Limits: Best Practices for Developers — link from the section about HTTP 429 responses and retry behavior.
- CAPTCHA API Error Codes: Common Errors and How to Fix Them — link from the error-monitoring section.
- CAPTCHA API Integration Testing: A Complete Guide — link from the automated-testing section.
- How to Integrate a CAPTCHA Solver API with Node.js: A Complete Guide — link from the Node.js instrumentation example.
Use the actual published URLs when adding links.
Suggested Image Alt Text
Dashboard showing CAPTCHA API latency and error-rate metricsMonitoring CAPTCHA API request duration and timeout frequencyAPI reliability dashboard with latency percentiles and HTTP error rates
Recommended Schema Markup
Consider adding Article schema and, if appropriate for your website and implementation, BreadcrumbList schema. Use FAQPage markup only when the page meets Google's current eligibility requirements; adding FAQ markup does not guarantee a rich result.